|
||
|
|
||
This page last updated February 8, 2024 |

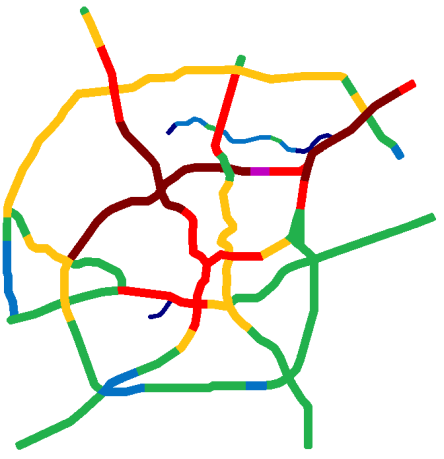
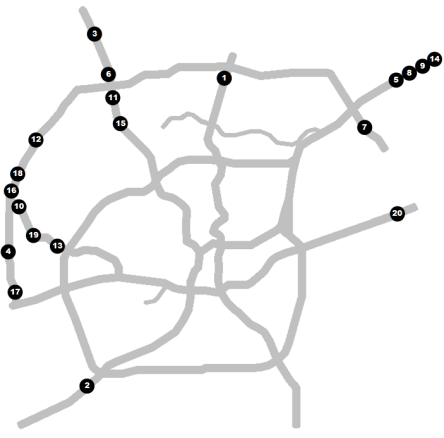
Below are tables and maps tabulating Annual Average Daily Traffic (AADT) counts on San Antonio's freeways for 2022. The comments, rankings, and calculations are the author's own analysis based on raw data from TxDOT.
The tables below are citywide. For traffic counts only on a specific corridor, see that freeway's individual page elsewhere on this site.
|
ADVERTISEMENT |
Summary
Traffic counts in 2022 mostly showed a continued post-pandemic recovery, with about half of the counter locations now showing volumes equal to or greater than 2019, and another 22 within 5% of their 2019 counts.
There was no change in the top six rankings since last year, with all but one being on Loop 410. The top spot continues to be Loop 410 near Nacogdoches, with over 300,000 vehicles per day. Because this counter location was new last year, there isn't a pre-pandemic count for comparison, but it did increase 1.75% over last year, and its count is slightly higher than the top spot in 2019, which was 305,674 at Loop 410 and Blanco.
Like last year, all of the top 20 traffic counts are located on Loop 410 North, I‑35 North, and I‑10 West.
With the pandemic recovery still continuing in 2021, I'm still comparing to the pre-pandemic numbers in 2019. The top growth spots since then are widely scattered. The top growth location was US 281 just inside Loop 1604, possibly attributable to the completion of phase 1 of the US 281 expansion project in 2022. The number two spot for the second year in a row was I‑35 near Fischer Rd., likely due to a new Amazon center and other industrial development nearby. Most of the remaining top 20 locations were in one of three clusters: the Loop 1604 West and SH 151 corridors, the I‑10 West corridor outside Loop 410, and I‑35 North in the Schertz area. Two remaining locations were outliers: Loop 1604 near Pat Booker Rd., and I‑10 near Loop 1604 on the East Side.
Like with the three-year growth list, the list of top growth locations over the last decade has a large cluster of spots in the Loop 1604 West and SH 151 corridors, I‑35 at Fischer, I‑10 on the far northwest side, and I‑10 East near Loop 1604. However, additional locations along I‑10 East outside Loop 410 also made the list, and there was a cluster of locations along eastern Wurzbach Pkwy.
As a reminder, TxDOT made some significant changes to traffic counter locations last year, so many locations don't have data from previous years.
General statistics
Here are some general statistics for the local freeway system as a whole. The number in parenthesis is San Antonio's rank nationally for that category.
- Centerline miles of freeway: 253 (23)
- Interstate highway miles: 177
- US and State highway freeway miles: 76
- Percent of local roads that are freeways: 3.10% (21)
- Lane miles of freeway: 1,419 (23)
- Lane miles per 1,000 people: 0.807 (17)
- Daily vehicle miles driven on freeways: 22,213,000 (21)
- Percent of total local daily traffic carried on freeways: 48.5% (11)
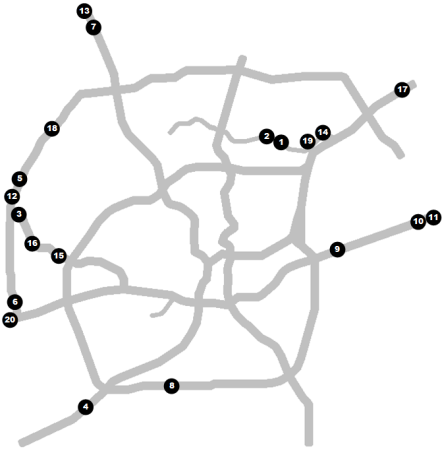
Average 2022 daily traffic by location
| FWY | LOCATION | 2022 AADT |
'19-'22 % CHG |
|
| 1 |  |
E of Nacogdoches Rd. | 306,104 | N/A |
| 2 | |
W of Fredericksburg Rd. | 295,345 | N/A |
| 3 | |
E of McCullough Ave. | 286,372 | -1.83% |
| 4 | |
Cherry Ridge Dr. | 283,908 | +2.86% |
| 5 | |
E of Blanco Rd. | 272,435 | -10.87% |
| 6 |  |
N of Callaghan Rd. | 253,181 | +5.00% |
| 7 | |
W of Evers Rd. | 243,855 | +6.66% |
| 8 |  |
S of Thousand Oaks | 237,645 | +0.90% |
| 9 | |
N of O'Connor Rd. | 231,683 | -0.24% |
| 10 | |
S of Bandera Rd. | 226,303 | +3.71% |
| 11 | |
Bexar/Guadalupe line | 222,111 | +29.32% |
| 12 | |
S of Culebra Rd. | 221,338 | N/A |
| 13 | |
E of Honeysuckle Ln. | 218,396 | N/A |
| 14 | |
S of Crossroads Blvd. | 216,551 | +5.09% |
| 15 | |
N of DeZavala Rd. | 208,179 | +4.60% |
| 16 | |
N of Huebner Rd. | 205,973 | +12.93% |
| 17 | |
N of Walzem Rd. | 202,265 | +0.02% |
| 18 | |
S of St. Mary's St. | 196,854 | 0.00% |
| 19 | |
W of I-35 | 196,369 | N/A |
| 20 | |
S of Hildebrand | 193,828 | N/A |
| 21 | |
W of Frio St. | 187,233 | -0.04% |
| 22 | |
S of FM 3009 | 186,124 | +25.35% |
| 23 | |
N of UTSA Blvd. | 183,748 | +17.72% |
| 24 | |
S of Rittiman Rd. | 183,254 | -10.37% |
| 25 |  |
S of Nakoma Rd. | 176,296 | -9.49% |
| 26 | |
S of Laredo St. | 173,066 | +0.66% |
| 27 | |
S of Walzem Rd. | 170,062 | -20.10% |
| 28 | |
W of New Braunfels Ave. | 169,816 | -3.35% |
| 29 | |
W of Perrin-Beitel Rd. | 169,318 | N/A |
| 30 | |
S of Commerce St. | 169,296 | N/A |
| 31 |  |
E of Zarzamora St. | 162,240 | -2.09% |
| 32 | |
S of US 90 | 161,072 | +1.81% |
| 33 | |
E of Cupples Rd. | 159,306 | +6.46% |
| 34 | |
S of Loop 1604 | 158,128 | +48.22% |
| 35 | |
N of Cibolo Valley Dr. | 155,912 | +23.37% |
| 36 | |
S of Brookhollow Dr. | 155,645 | -7.99% |
| 37 | |
N of Loop 1604NW | 154,479 | +27.26% |
| 38 | |
E of Perrin-Beitel Rd. | 153,459 | -5.89% |
| 39 | |
W of General McMullen Dr. | 151,656 | N/A |
| 40 | |
W of Probandt St. | 151,312 | +1.13% |
| 41 | |
N of Marbach Rd. | 143,204 | N/A |
| 42 |  |
E of Potranco Rd. | 140,491 | +16.29% |
| 43 | |
N of Salado Creek | 140,421 | -2.32% |
| 44 | |
N of Hildebrand Ave. | 139,941 | -17.60% |
| 45 | |
S of Hildebrand Ave. | 138,119 | N/A |
| 46 | |
E of Probandt St. | 138,021 | -7.58% |
| 47 | |
N of Dominion Dr. | 136,247 | +38.60% |
| 48 | |
N of FM 2252 | 132,938 | +13.31% |
| 49 |  |
N of Culebra Rd. | 130,444 | +9.24% |
| 50 | |
N of I-35 | 129,380 | N/A |
| 51 | |
S of Culebra Rd. | 129,333 | +12.29% |
| 52 |  |
S of I-35 | 127,190 | -20.10% |
| 53 | |
W of US 281N | 125,841 | -4.05% |
| 54 | |
W of NW Military Hwy. | 125,360 | N/A |
| 55 | |
N of I-10E | 122,693 | N/A |
| 56 | |
S of Sunset Rd. | 121,661 | -19.17% |
| 57 | |
N of Fair Ave. | 121,215 | -12.39% |
| 58 | |
N of Basse Rd. | 120,476 | -19.70% |
| 59 | |
S of Bandera Rd. | 120,361 | +17.65% |
| 60 | |
N of Cesar Chavez Blvd. | 120,260 | -11.91% |
| 61 | |
W of Vance Jackson Rd. | 119,379 | -18.74% |
| 62 | |
N of SW Military Dr. | 116,950 | +0.71% |
| 63 | |
E of Bitters Rd. | 116,008 | -29.36% |
| 64 | |
E of Gold Canyon Rd. | 115,802 | -8.31% |
| 65 | |
N of US 90W | 114,920 | -9.69% |
| 66 | |
W of Hunt Ln. | 114,247 | +8.68% |
| 67 | |
S of Braun Rd. | 112,745 | N/A |
| 68 | |
W of I-10W | 112,733 | -16.33% |
| 69 | |
W of I-35N | 110,652 | -12.72% |
| 70 | |
N of Bandera Rd. | 110,080 | -19.15% |
| 71 | |
W of O'Connor Rd. | 109,716 | -7.17% |
| 72 | |
S of US 90W | 105,057 | -13.54% |
| 73 | |
N of Hausmann Rd. | 104,741 | -10.02% |
| 74 | |
N of Lookout Rd. | 101,808 | -17.37% |
| 75 | |
S of Loop 410 | 98,867 | +5.29% |
| 76 | |
W of Military Dr. | 94,904 | +5.66% |
| 77 | |
N of George Beach Ave. | 94,172 | -24.20% |
| 78 | |
W of Gevers St. | 93,944 | +5.56% |
| 79 | |
S of Medina Base Rd. | 93,387 | N/A |
| 80 | |
S of Redland Rd. (ML only) | 92,059 | -7.56% |
| 81 | |
N of Hot Wells Blvd. | 91,747 | -11.54% |
| 82 | |
N of Nacogdoches Rd. | 91,556 | -19.33% |
| 83 | |
N of Zarzamora St. | 91,308 | +0.57% |
| 84 | |
W of Hunt Ln. | 86,153 | +3.42% |
| 85 | |
N of Loop 410 | 85,176 | -14.98% |
| 86 | |
N of FM 3351 | 84,329 | +4.44% |
| 87 | |
E of Loop 1604 | 83,472 | +23.29% |
| 88 | |
S of Loop 410 | 83,400 | -1.59% |
| 89 | |
S of Fischer Rd. | 83,046 | +39.24% |
| 90 | |
N of I-10E | 82,179 | -0.57% |
| 91 | |
N of Pat Booker Rd. | 82,167 | -19.63% |
| 92 | |
E of Old Hwy 90 | 81,858 | +1.69% |
| 93 | |
S of I-10E | 80,928 | -3.16% |
| 94 | |
S of Pat Booker Rd. | 78,128 | +25.63% |
| 95 | |
E of Martin Luther King Jr. Dr. | 77,787 | -0.11% |
| 96 | |
S of E. Houston St. | 77,783 | -0.99% |
| 97 | |
N of SW Military Dr. | 76,151 | -11.59% |
| 98 | |
N of US 90 | 75,946 | -12.36% |
| 99 | |
E of WW White Rd. | 75,896 | -4.92% |
| 100 | |
E of Foster Rd. | 75,674 | +0.25% |
| 101 | |
W of WW White Rd. | 74,960 | -3.97% |
| 102 | |
S of Pearsall Rd. | 74,040 | N/A |
| 103 | |
E of Loop 410 | 74,005 | -10.49% |
| 104 | |
E of Callaghan Rd. | 72,917 | N/A |
| 105 | |
S of SH 151 | 72,309 | N/A |
| 106 | |
W of Loop 1604E | 70,701 | +8.24% |
| 107 | |
N of Pearsall Rd. | 70,214 | -8.20% |
| 108 | |
N of Loop 410 | 69,731 | -5.97% |
| 109 | |
N of FM 78 | 67,079 | -6.59% |
| 110 | |
S of Rigsby | 65,832 | +0.22% |
| 111 |  |
W of US 281N | 64,456 | N/A |
| 112 | |
S of Potranco Rd. | 63,280 | N/A |
| 113 | |
W of FM 78 | 61,606 | -8.81% |
| 114 | |
E of Ackerman Rd. | 60,489 | +6.06% |
| 115 | |
N of Loop 1604 | 60,225 | N/A |
| 116 | |
S of Southcross Blvd. | 59,595 | -2.91% |
| 117 | |
W of Roosevelt Ave. | 59,079 | -0.99% |
| 118 | |
E of Loop 1604E | 56,744 | +0.76% |
| 119 | |
W of I-37 | 56,706 | -6.59% |
| 120 | |
E of I-37 | 55,100 | -2.23% |
| 121 | |
W of Loop 1604 | 53,929 | +1.04% |
| 122 | |
N of Cassin Rd. | 51,499 | +2.26% |
| 123 | |
E of Poteet-Jourdanton Fwy. | 51,436 | -3.22% |
| 124 | |
E of Starcrest Blvd. | 50,736 | -3.89% |
| 125 | |
N of New Laredo Hwy. | 49,352 | +1.57% |
| 126 | |
E of Roosevelt Ave. | 47,973 | -9.07% |
| 127 | |
E of Somerset Rd. | 47,757 | -3.42% |
| 128 | |
E of I-35S | 46,813 | N/A |
| 129 | |
W of West Ave. | 46,601 | -1.10% |
| 130 | |
N of US 90W | 45,557 | +10.62% |
| 131 | |
E of Wetmore Rd. | 44,641 | -9.26% |
| 132 | |
E of US 281N | 43,699 | -1.89% |
| 133 | |
E of FM 78 | 43,030 | +2.69% |
| 134 | |
E of NW Military Hwy. | 42,784 | +5.01% |
| 135 | |
N of Potranco Rd. | 42,774 | +35.67% |
| 136 | |
E of Perrin-Beitel Rd. | 37,424 | -30.47% |
| 137 | |
E of Weidner Rd. | 23,436 | -7.48% |
| 138 |  |
S of US 90 | 16,312 | +5.95% |
| 139 | |
At Port SA | 15,013 | +1.43% |
|
ADVERTISEMENT |
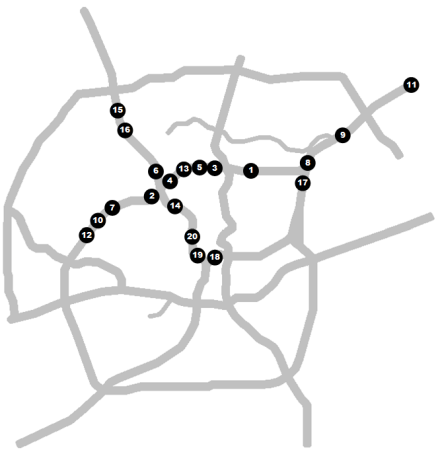
Top 20 three-year growth locations
With pandemic traffic recovery still underway in 2021, this table still reflects growth since 2019 (pre-pandemic.)
| FWY | LOCATION | '19-'22 % CHG |
|
| 1 | |
S of Loop 1604 | +48.22% |
| 2 | |
S of Fischer Rd. | +39.24% |
| 3 | |
N of Dominion Dr. | +38.60% |
| 4 | |
N of Potranco Rd. | +35.67% |
| 5 | |
Bexar/Guadalupe line | +29.32% |
| 6 | |
N of Loop 1604NW | +27.26% |
| 7 | |
S of Pat Booker Rd. | +25.63% |
| 8 | |
S of FM 3009 | +25.35% |
| 9 | |
N of Cibolo Valley Dr. | +23.37% |
| 10 | |
E of Loop 1604 | +23.29% |
| 11 | |
N of UTSA Blvd. | +17.72% |
| 12 | |
S of Bandera Rd. | +17.65% |
| 13 | |
E of Potranco Rd. | +16.29% |
| 14 | |
N of FM 2252 | +13.31% |
| 15 | |
N of Huebner Rd. | +12.93% |
| 16 | |
S of Culebra Rd. | +12.29% |
| 17 | |
N of US 90W | +10.62% |
| 18 | |
N of Culebra Rd. | +9.24% |
| 19 | |
W of Hunt Ln. | +8.68% |
| 20 | |
W of Loop 1604E | +8.24% |
Top 20 growth locations since 2012
| FWY | LOCATION | '12-'22 % CHG |
|
| 1 |  |
E of Wetmore Rd. | +123.21% |
| 2 | |
E of Starcrest Blvd. | +120.59% |
| 3 |  |
E of Loop 1604 | +85.49% |
| 4 |  |
S of Fischer Rd. | +84.55% |
| 5 |  |
N of Culebra Rd. | +76.28% |
| 6 | |
N of US 90W | +75.22% |
| 7 |  |
N of Dominion Dr. | +64.15% |
| 8 |  |
E of Poteet-Jourdanton Fwy. | +60.74% |
| 9 | |
E of Ackerman Rd. | +59.18% |
| 10 | |
W of Loop 1604E | +53.70% |
| 11 | |
E of Loop 1604E | +53.36% |
| 12 | |
S of Culebra Rd. | +52.16% |
| 13 | |
N of FM 3351 | +50.59% |
| 14 | |
E of Weidner Rd. | +48.33% |
| 15 | |
E of Potranco Rd. | +47.89% |
| 16 | |
W of Hunt Ln. | +46.47% |
| 17 | |
Bexar/Guadalupe line | +45.17% |
| 18 | |
S of Bandera Rd. | +45.01% |
| 19 | |
E of Perrin-Beitel Rd. | +43.94% |
| 20 |  |
W of Loop 1604 | +41.92% |